Deploy to the OL Hub Runtime
Overview
An OL Hub Admin can deploy a Project to an OL Hub Managed Service on AWS Cloud.
The Project Deployment Wizard takes a project created by the user and runs it through the steps to deploy it. The user has the option of selecting the deployment environment, profile, connection profile and project variables to be used.
After the project is successfully deployed, the user can view and manage the project in Runtime (OpenLegacy Managed Services Runtime in AWS Cloud).
Procedure
-
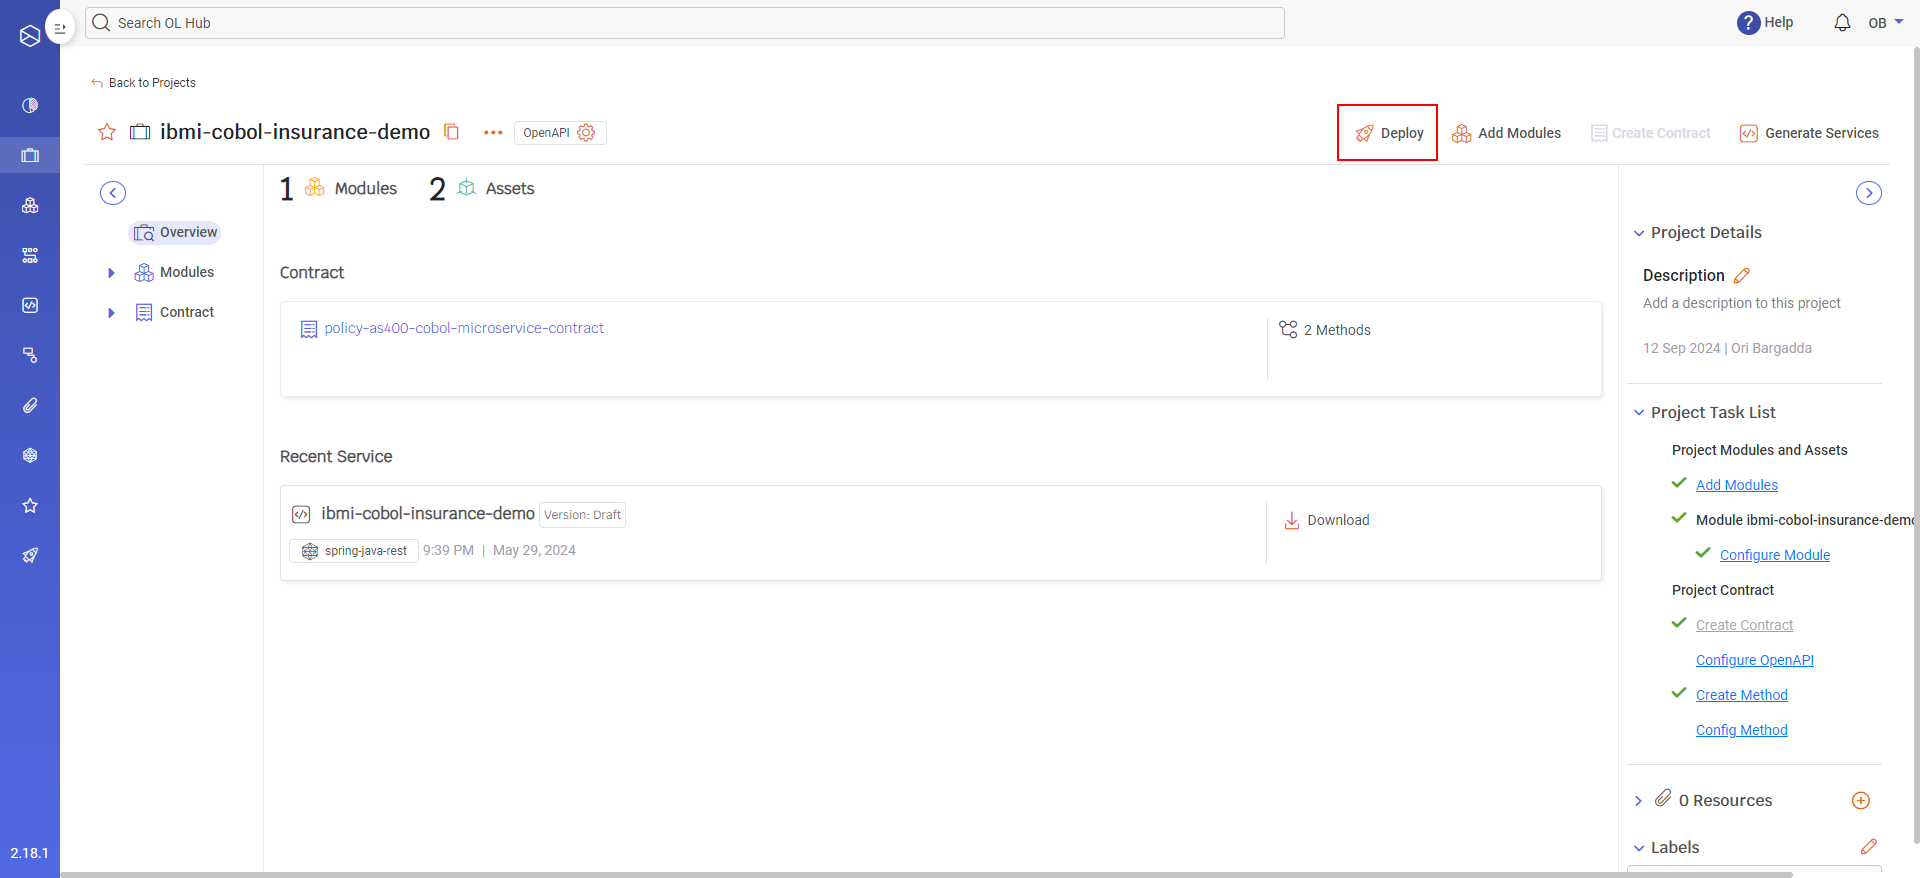
On the Projects page, select the project to be deployed.
-
Click on the Deploy button. The Deploy Project page displays.
Note: The Deploy button is enabled only if there is at least one published method in the project.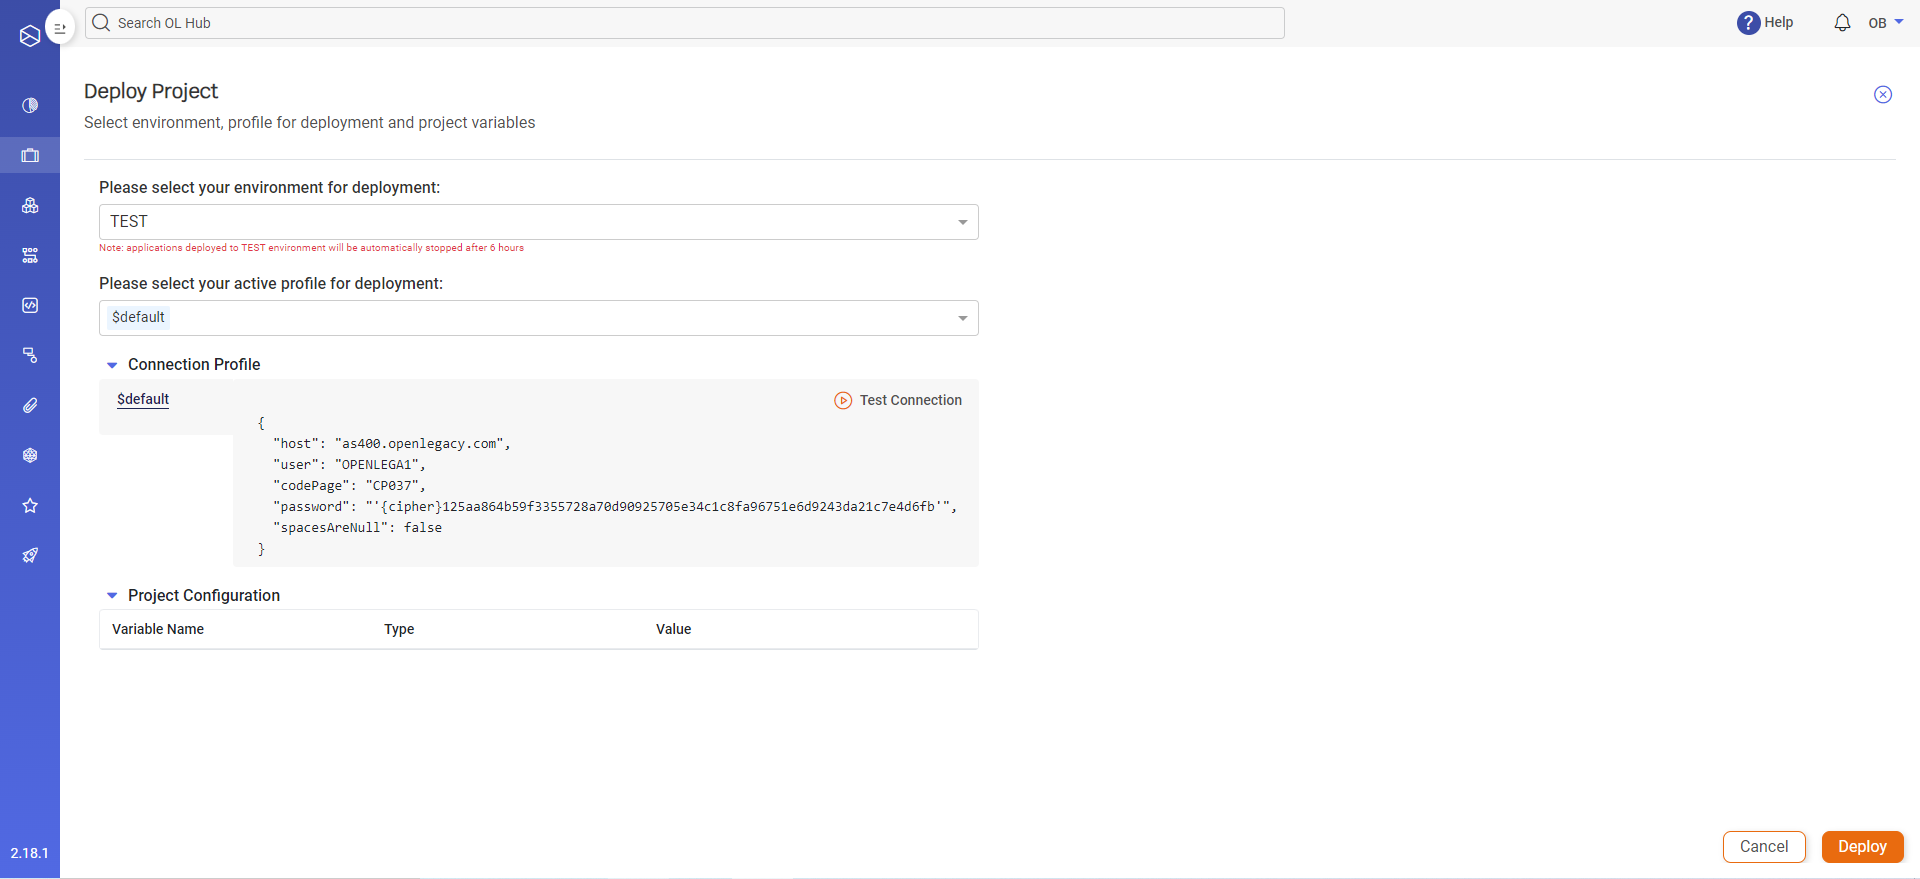
-
Select the deployment environment from the list. Currently, there are two environments: TEST and PROD. The TEST env limitations are displayed in red.
-
Select the active profile for deployment. You can select more one than one profile. It will behave as in the test flow.
-
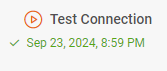
Select the Connection Profile. You can check its validity by clicking Test Connection:
-
You can view the Project Configuration to display project variables. If you created project variables when creating the project, you can assign them values here. For example, if one of parameters is a file name, you can deploy it with the file name value.
-
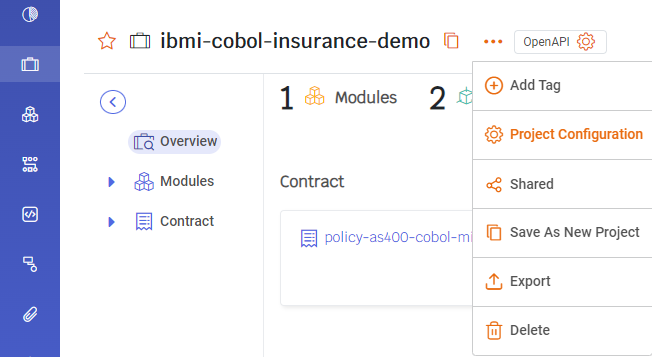
To add/edit/delete project variables, go back to the project page and select Project Configuration from the menu:
-
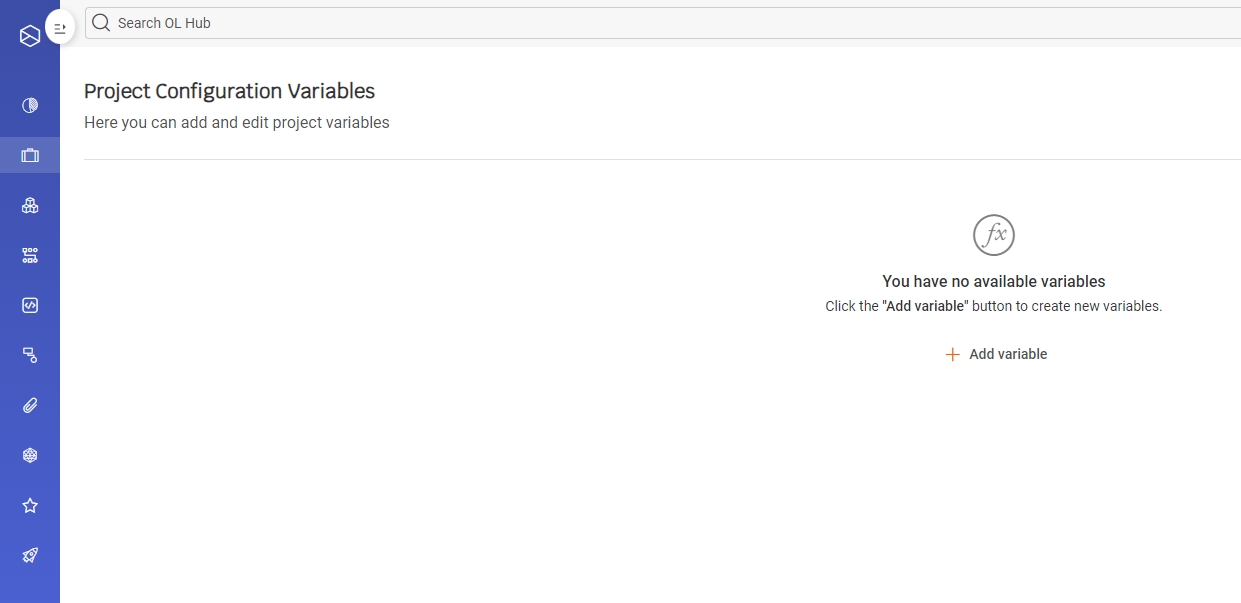
The Project Configuration Variables page displays:
-
Add/edit project variables as needed.
-
-
Press the Deploy button. A progress bar displays at the top of the page:

-
When the deployment completes, a success message displays:

-
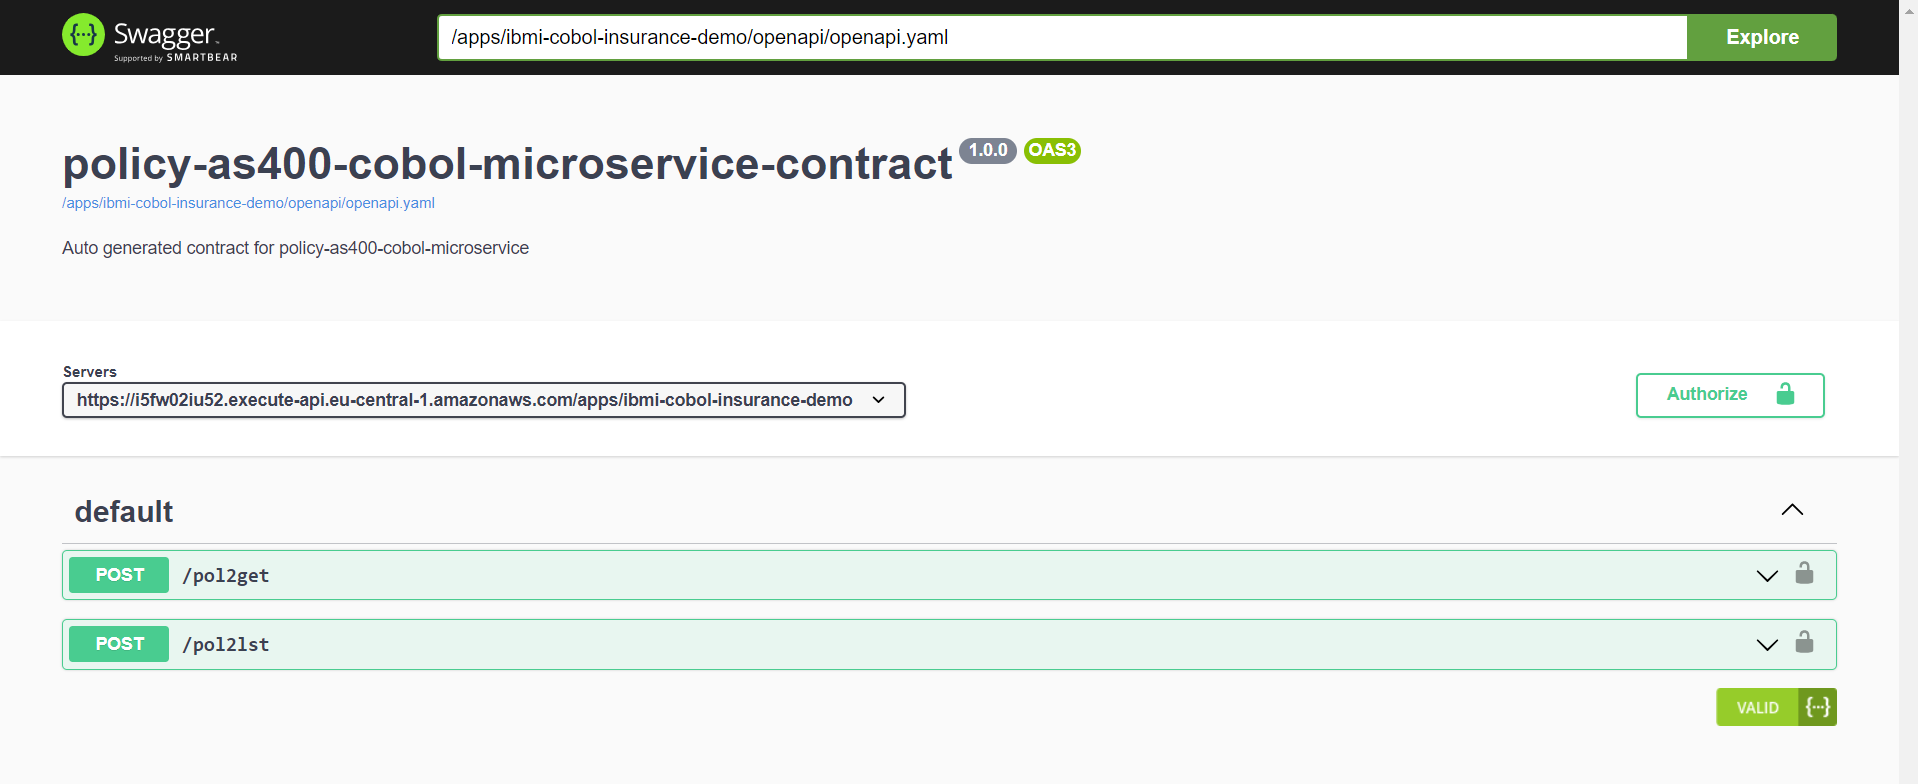
You can view the project APIs by clicking on Service Swagger Page on the right-hand side of the success message. This opens the api yaml file in Swagger in a new browser tab.